- My Forums
- Tiger Rant
- LSU Recruiting
- SEC Rant
- Saints Talk
- Pelicans Talk
- More Sports Board
- Coaching Changes
- Fantasy Sports
- Golf Board
- Soccer Board
- O-T Lounge
- Tech Board
- Home/Garden Board
- Outdoor Board
- Health/Fitness Board
- Movie/TV Board
- Book Board
- Music Board
- Political Talk
- Money Talk
- Fark Board
- Gaming Board
- Travel Board
- Food/Drink Board
- Ticket Exchange
- TD Help Board
Customize My Forums- View All Forums
- Show Left Links
- Topic Sort Options
- Trending Topics
- Recent Topics
- Active Topics
Started By
Message

Weather geeks: Map depicting Atlantic Cat 5 hurricane peak locations
Posted on 6/2/17 at 9:37 pm
Posted on 6/2/17 at 9:37 pm
There have been 31 Category 5 hurricanes since 1851 recorded in the Atlantic. Here is where they peaked:
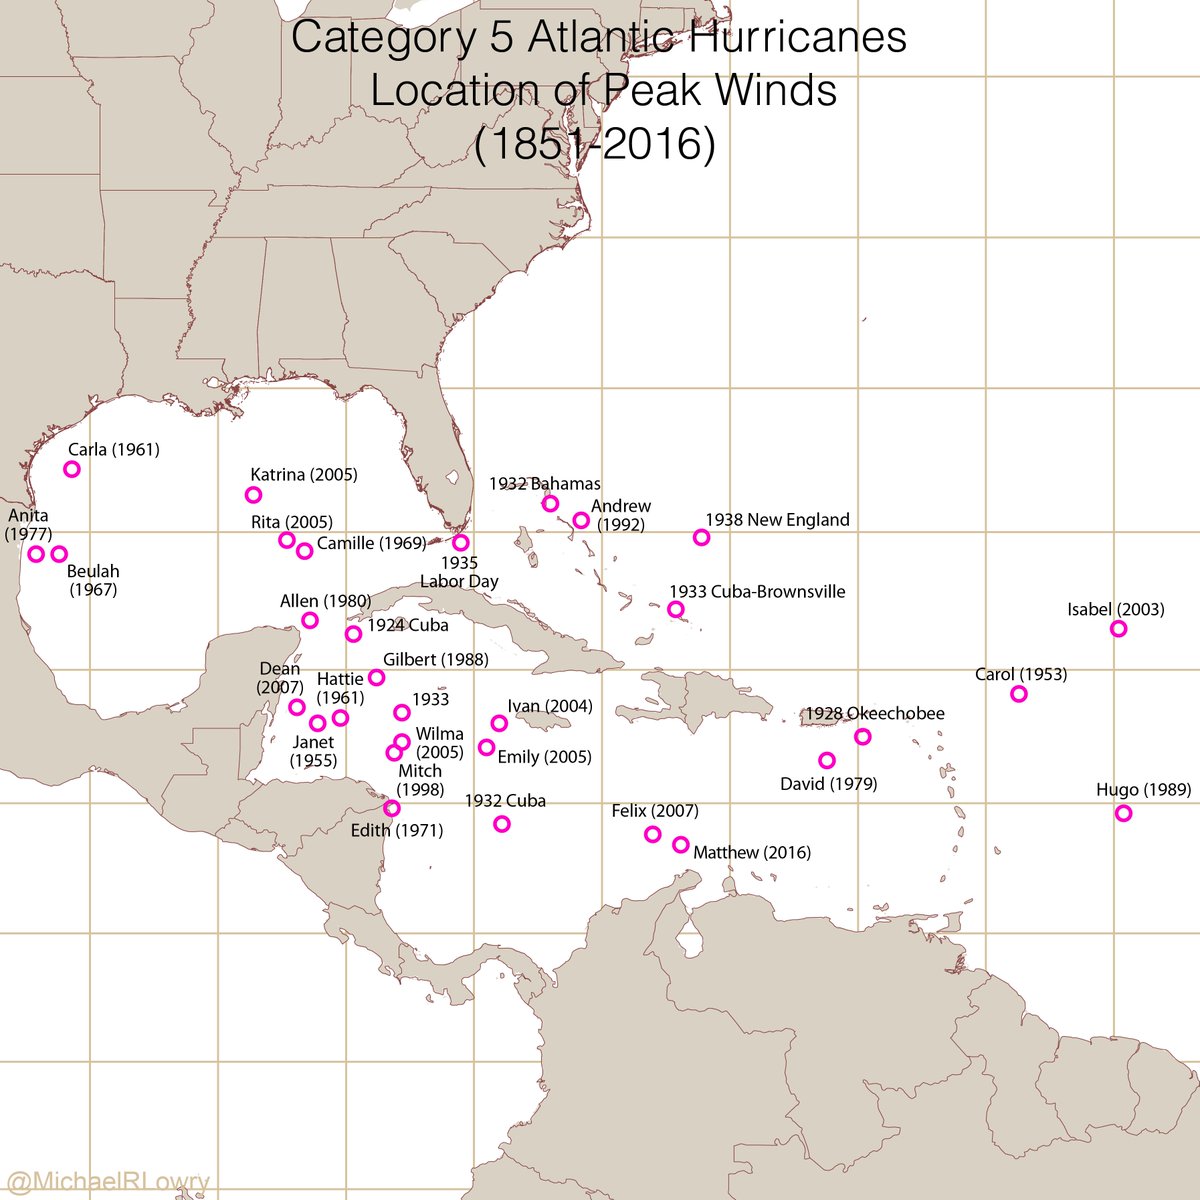
Strangely seems like the Gulf of Mexico has had so few.
And the furthest north peak was Carla in 1961.
I know that hurricanes will tend to peak over open waters, but I'd figure that overall A. more would have peaked in the gulf and B. more would have peaked further north.
Strangely seems like the Gulf of Mexico has had so few.
And the furthest north peak was Carla in 1961.
I know that hurricanes will tend to peak over open waters, but I'd figure that overall A. more would have peaked in the gulf and B. more would have peaked further north.
 7
7


Posted on 6/2/17 at 9:47 pm to East Coast Band
The continental shelf decreases the depth of the gulf not too far north from the Katrina marker so that shouldn't be surprising that they all lose intensity just north of those dots.
Just got chills looking at the map and remembering that 2005 year. 4 of the 31 cat 5s in one year is nuts
Just got chills looking at the map and remembering that 2005 year. 4 of the 31 cat 5s in one year is nuts
This post was edited on 6/2/17 at 9:49 pm
Posted on 6/2/17 at 9:56 pm to Ba Ba Boooey
That map follows where the warmest waters typically are.
And yeah, 2005 was a bizarre year. Had to dip into the Greek alphabet for names there were so many storms. Two sub 900 mb hurricanes and the record lowest pressure in the Atlantic.
And yeah, 2005 was a bizarre year. Had to dip into the Greek alphabet for names there were so many storms. Two sub 900 mb hurricanes and the record lowest pressure in the Atlantic.
Posted on 6/2/17 at 11:01 pm to East Coast Band
quote:
I'd figure that overall A. more would have peaked in the gulf and B. more would have peaked further north.
A. The Gulf of Mexico comprises only a fraction of the total Atlantic Basin, so it stands to reason that fewer storms would occur there.
B. SSTs, as with atmospheric temperature, typically decrease at more northerly latitudes. While the Gulf Stream negates that in some areas of the Atlantic Coast, it's still such a small area of the overall basin.
There are so many other variables necessary for the formation of a major hurricane in addition to SST though. It's rare that all the conditions line up just perfectly.
Posted on 6/2/17 at 11:05 pm to East Coast Band
That 1938 new england may have peaked just north of south america but it sure as shite devastated long island and rhode island. Horror story.
Posted on 6/3/17 at 7:04 am to Duke
quote:
2005 was a bizarre year.
There were 8 in 5 seasons between 03 and 07. Very strange since we have had just 1 since.
With the oldest being 1924 on this map, let's assume we've averaged about 1 every 3 years over the past 90+ years.
Therefore, both the extremes of having 8 in 5 years and followed up with only 1 in 9 years is odd. Hopefully, we can continue on with the scarcity of them and not repeat an 03 to 07 run again anytime soon.

Posted on 6/3/17 at 7:12 am to East Coast Band
quote:
There were 8 in 5 seasons between 03 and 07. Very strange since we have had just 1 since.
There were four between 1932-1935 as well. It has to be some type of cyclical climate system where you get a high number of storms followed by relative calm for a longer period.

Posted on 6/3/17 at 7:36 am to East Coast Band
Some of the ones that aren't on the Gulf on the graphic, did eventually make it there, just not as a Cat 5 (Ivan, Wilma, Andrew). A lot of factors can contribute to their "weakening", but you can see how much land interaction a hurricane can potentially have before they get to the Gulf, that always hurts them some. That said, even a strong Cat 2 can be devastating, so there are many retired hurricanes that weren't Cat 5s that were catastrophic (such as Opal, Charley, Fredrick, etc).
Really cool map, thanks for sharing!
Really cool map, thanks for sharing!
This post was edited on 6/3/17 at 7:37 am
Posted on 6/3/17 at 10:12 am to East Coast Band
It seems that as the storms get closer to land that the feeder bands pull in cooler, drier air that causes the eye wall to begin to degrade.

Posted on 6/3/17 at 10:28 am to East Coast Band
Isabelle - 2003
Ivan - 2004
Katrina - 2005
Rita - 2005
Wilma - 2005
Emily - 2005
Dean - 2007
Felix - 2007
That is what is fricking crazy about this map. I'm sure hoping that was an anomaly.
Ivan - 2004
Katrina - 2005
Rita - 2005
Wilma - 2005
Emily - 2005
Dean - 2007
Felix - 2007
That is what is fricking crazy about this map. I'm sure hoping that was an anomaly.
Posted on 6/3/17 at 10:37 am to Sid in Lakeshore
QUESTION FOR METEORLOGISTS OF THE GROUP:
How far back are these records considered reliable. Obviously with today's technology there is no way that a hurricane will spawn and go unnoticed. Similarly we have capability of estimating the intensity with great precision. When did this begin?
I've been told that when using historical hurricane databases (GUMSHOE data) that pre-1950 data is usually anecdotal, ship reports or measurements at landfall, therefore track and intensity is not reliable. Similarly there is another jump in reliability between then and now.
Can any of you share your thoughts on this? And how do you go about increasing reliability of predicted independent extreme Met-ocean characteristics from a hindcast derived from a relatively short period of record? Seems like running thousands of Monte Carlo simulations might help, but GIGO.

Posted on 6/3/17 at 10:40 am to East Coast Band
Water temps are cooler further north.
As for the gulf storms usually have to interact with land at some point when entering the gulf so that hinders cat 5 occurrences in the gulf. im sure there's probably a more scientific reason thrown in as well that has to do with the amount of water and temps im just not sure how to explain it.
As for the gulf storms usually have to interact with land at some point when entering the gulf so that hinders cat 5 occurrences in the gulf. im sure there's probably a more scientific reason thrown in as well that has to do with the amount of water and temps im just not sure how to explain it.
Posted on 6/3/17 at 10:42 am to Sid in Lakeshore
A lot of accuracy beyond the implementation of both satellites and radar is shaky at best.
And even then a lot of the data before the implementation of the current radar system (WSR-88D) is pretty shaky.
And even then a lot of the data before the implementation of the current radar system (WSR-88D) is pretty shaky.
This post was edited on 6/3/17 at 10:45 am
Posted on 6/3/17 at 11:21 am to CelticDog
quote:
That 1938 new england may have peaked just north of south america but it sure as shite devastated long island and rhode island. Horror story.
History channel did a good documentary on that hurricane a few years ago.
A category 5 slamming into Manhattan is one of the worst things that could happen to this country right now.

Posted on 6/3/17 at 11:30 am to VADawg
Look how far Hugo was at its peak.... and was still a very strong storm once it hit the states....amazing....

Posted on 6/3/17 at 11:39 am to Pedro
I'd love to see SST and ENSO cycle data from these years and compare them...

 Page 1 of 1


Popular
Back to top